Key Takeaways
- OpenClaw agents are powerful but operate in a black box, leading to silent failures, unpredictable costs, and impossible-to-debug performance issues.
- Existing observability tools (Datadog, LangSmith) are fundamentally incompatible with OpenClaw's architecture and the semantic nature of agentic workflows.
- ClawTrace provides a zero-code-change, plug-and-play control plane for OpenClaw, offering an Execution Path, Call Graph, and Timeline for every agent run.
- Our AI analyst, Tracy, uses a Claude Managed Agent and Cypher queries on a PuppyGraph backend to diagnose issues from plain English questions, moving beyond dashboards to direct answers.
- ClawTrace is the essential infrastructure for moving agents from prototype to production, ensuring reliability, cost-efficiency, and speed.
The age of autonomous agents is here. We’re not talking about demos or toys anymore. We’re talking about production systems, complex multi-agent workflows, and the dawn of true Agent-as-a-Service (AaaS) architectures. The engine for this revolution is OpenClaw. It’s the open standard for building, composing, and deploying serious, production-grade agents.
But there’s a fatal flaw in the current ecosystem. A gaping, terrifying blind spot.
You’re flying blind.
When your OpenClaw agent, powered by a chain of GPT-5 and Claude 4 calls, silently fails in the middle of a critical customer-facing task, you have no idea why. When a routine job that usually costs $1.50 suddenly burns through $104.70 in credits, you can’t trace the source of the hemorrhage. When a trajectory that should take 30 seconds grinds on for three minutes, you’re left guessing where the bottleneck is.
You’re reduced to grep-ing through mountains of raw JSON logs, manually estimating token counts, and trying to reconstruct the ghost of an execution path in your head. This isn't engineering. It's digital archaeology. And it absolutely does not scale.
Today, we’re fixing this. We’re giving you the control plane you deserve. We’re launching ClawTrace, the observability and reliability platform built from the ground up for OpenClaw agents.
The Anatomy of a Production Nightmare
Deploying an OpenClaw agent is deceptively simple. Understanding its behavior in the wild is a nightmare. The problem isn’t a lack of data; it’s a lack of intelligible data. The core challenge is that agentic workflows are not like traditional microservices. They are dynamic, non-deterministic, and deeply semantic.
This is why existing tools fail so spectacularly:
- General Distributed Tracing is Clueless. Tools like Datadog, Jaeger, and Zipkin are masterpieces of engineering for the microservices world. But for agents, they are worse than useless—they are misleading. They see an HTTP call to an OpenAI endpoint. They have no concept of a "prompt," a "completion," a "token," or the staggering cost difference between a 100k context window call to Claude 4 and a simple function call. They can’t understand the hierarchical nature of sub-agent delegation or the looping structure of a ReAct pattern. They see the syntax of the transaction, but are utterly blind to the semantics of the operation.
- Framework-Specific Tools Are Walled Gardens. Yes, tools like LangSmith exist. They are excellent—if you’ve committed your entire stack to their proprietary framework. But the serious players, the teams building for the long term, are standardizing on OpenClaw for its power, flexibility, and open ecosystem. If you’re on OpenClaw, you’ve been left on your own, forced to choose between a walled garden and a barren wasteland.
- Point Solutions Create a Frankenstein's Monster. You can try to stitch it together yourself. A logging tool here, a cost-tracker there, maybe a separate evaluation dashboard. You end up with five different tabs open, trying to correlate timestamps and trace IDs manually. You’ve traded one problem—a lack of visibility—for another: a fragmented, unmanageable mess of dashboards that requires a full-time analyst just to interpret. There is no single source of truth. There is no control plane.
Every single one of these "solutions" dumps raw data on your screen and expects you to do the hard work of synthesis and analysis. They give you data, but they never give you answers.
One Plugin. Three Commands. Total Clarity.
We built ClawTrace on a simple, non-negotiable principle: observability should not require you to rewrite your agent. It should be a seamless, non-invasive layer that adds immediate value with minimal effort.
Getting started is this simple:
openclaw plugins install @epsilla/clawtrace
openclaw clawtrace setup
openclaw gateway restart
That’s it. Zero code changes to your agent.
From that moment on, every single trajectory—every LLM call, every tool execution, every sub-agent delegation—is automatically captured, parsed, and streamed to your ClawTrace dashboard.
Instantly, you go from blindness to omniscience. Here’s what you see:
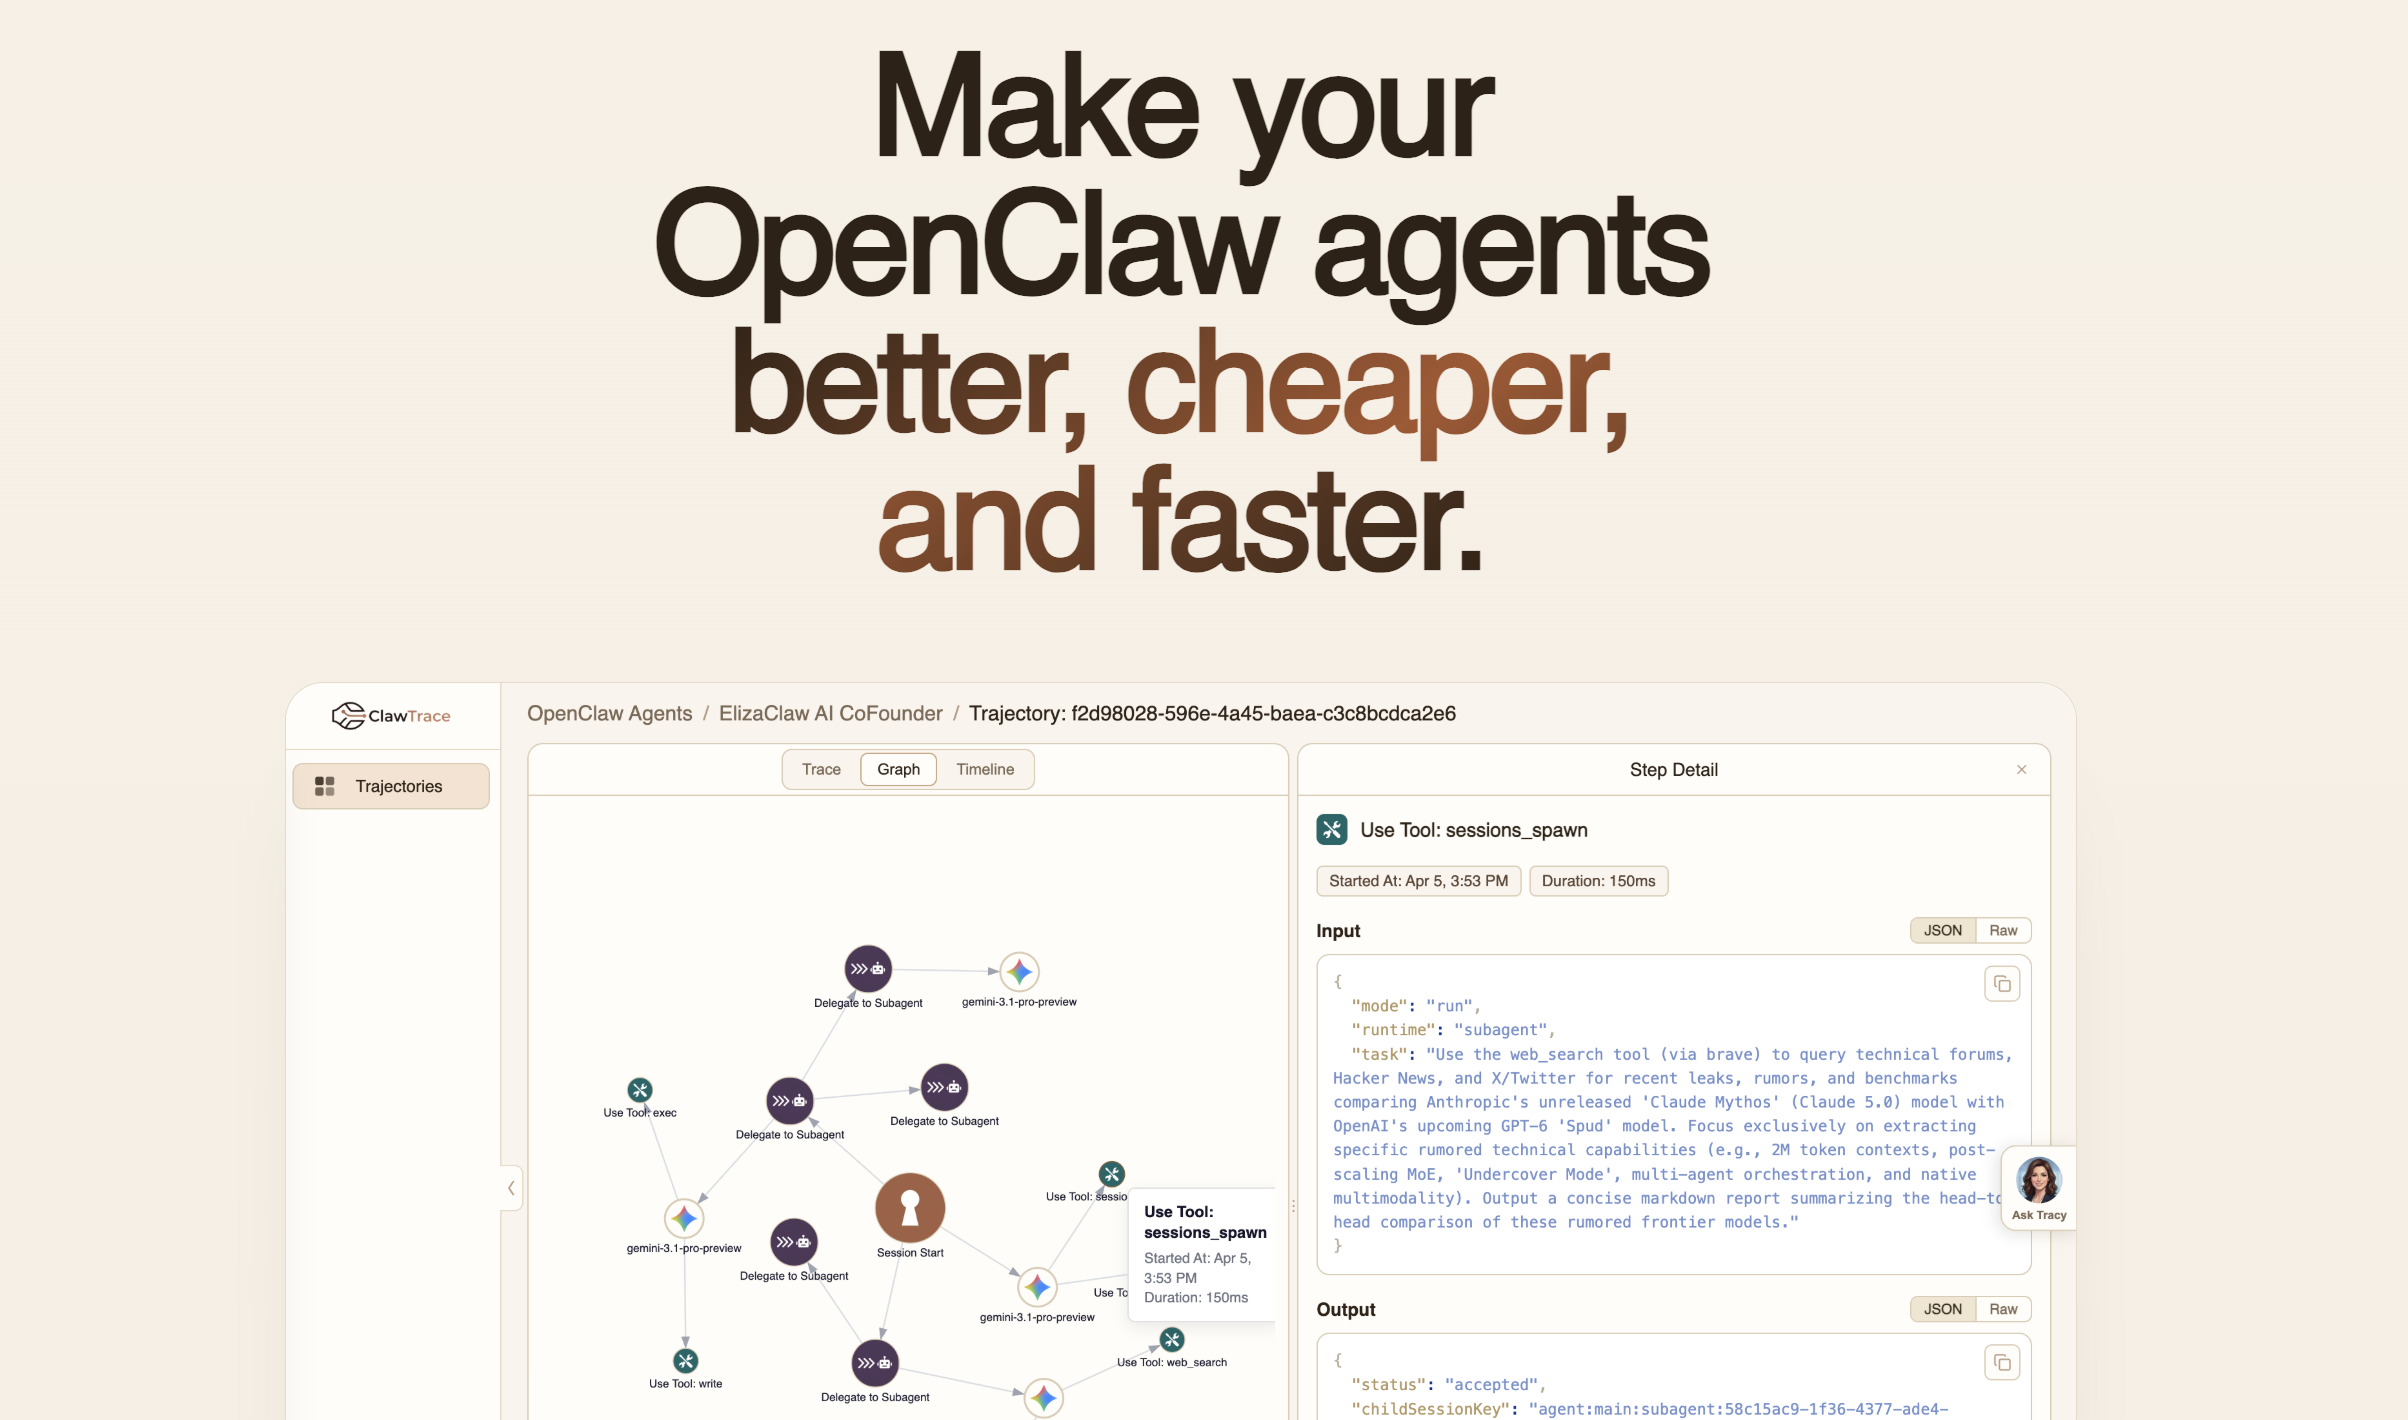
1. The Execution Path: Your Agent's Ground Truth
Forget reading logs. The Execution Path is a collapsible, hierarchical tree view of every single step your agent took. Each node represents an action—an LLM call, a tool use, a sub-agent run—with the full input and output payloads available for inspection. Inline, you get critical metadata badges: the model used (e.g., gpt-5-turbo), the precise duration, token counts, and the estimated cost. You can finally see the exact, step-by-step logic your agent followed and pinpoint the exact moment things went right—or wrong.
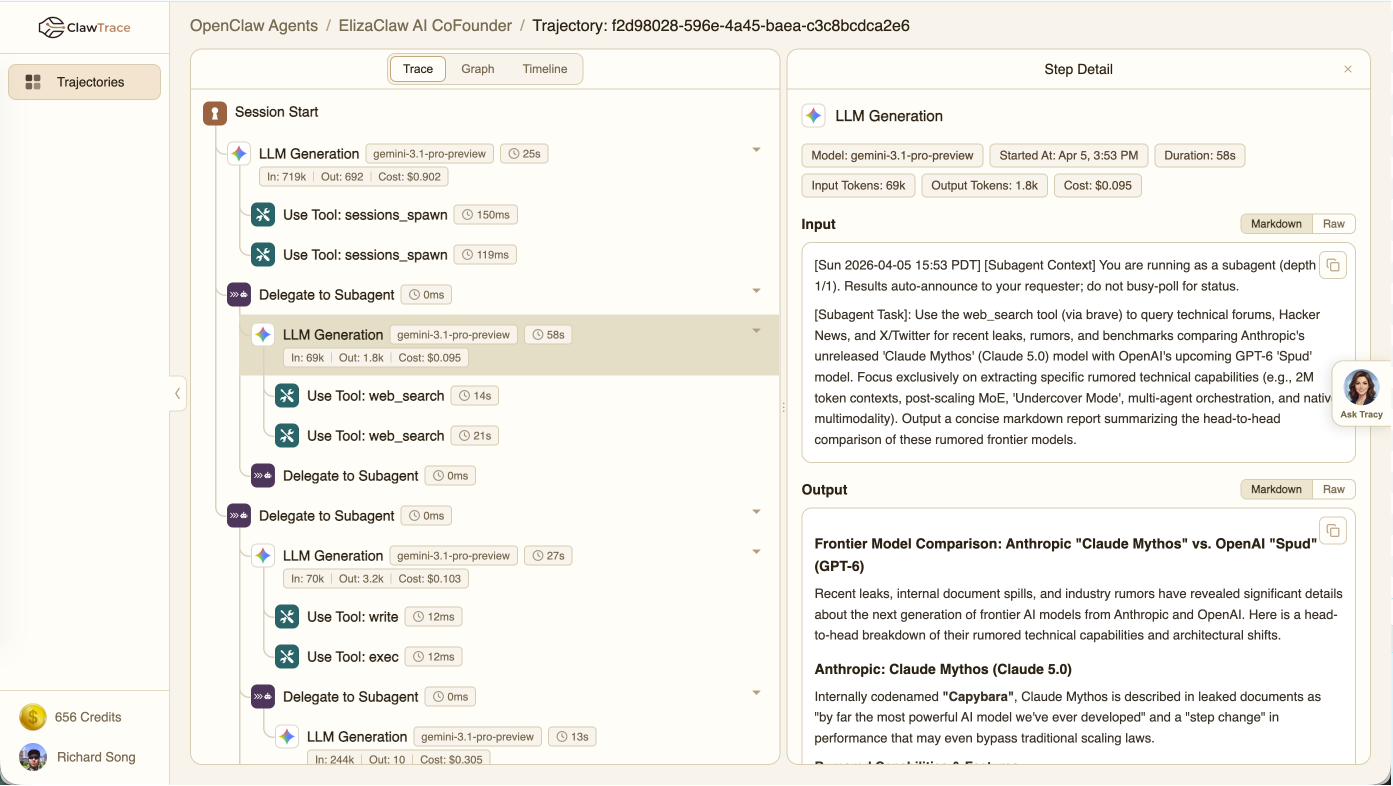
2. The Call Graph: The Shape of Your Workflow
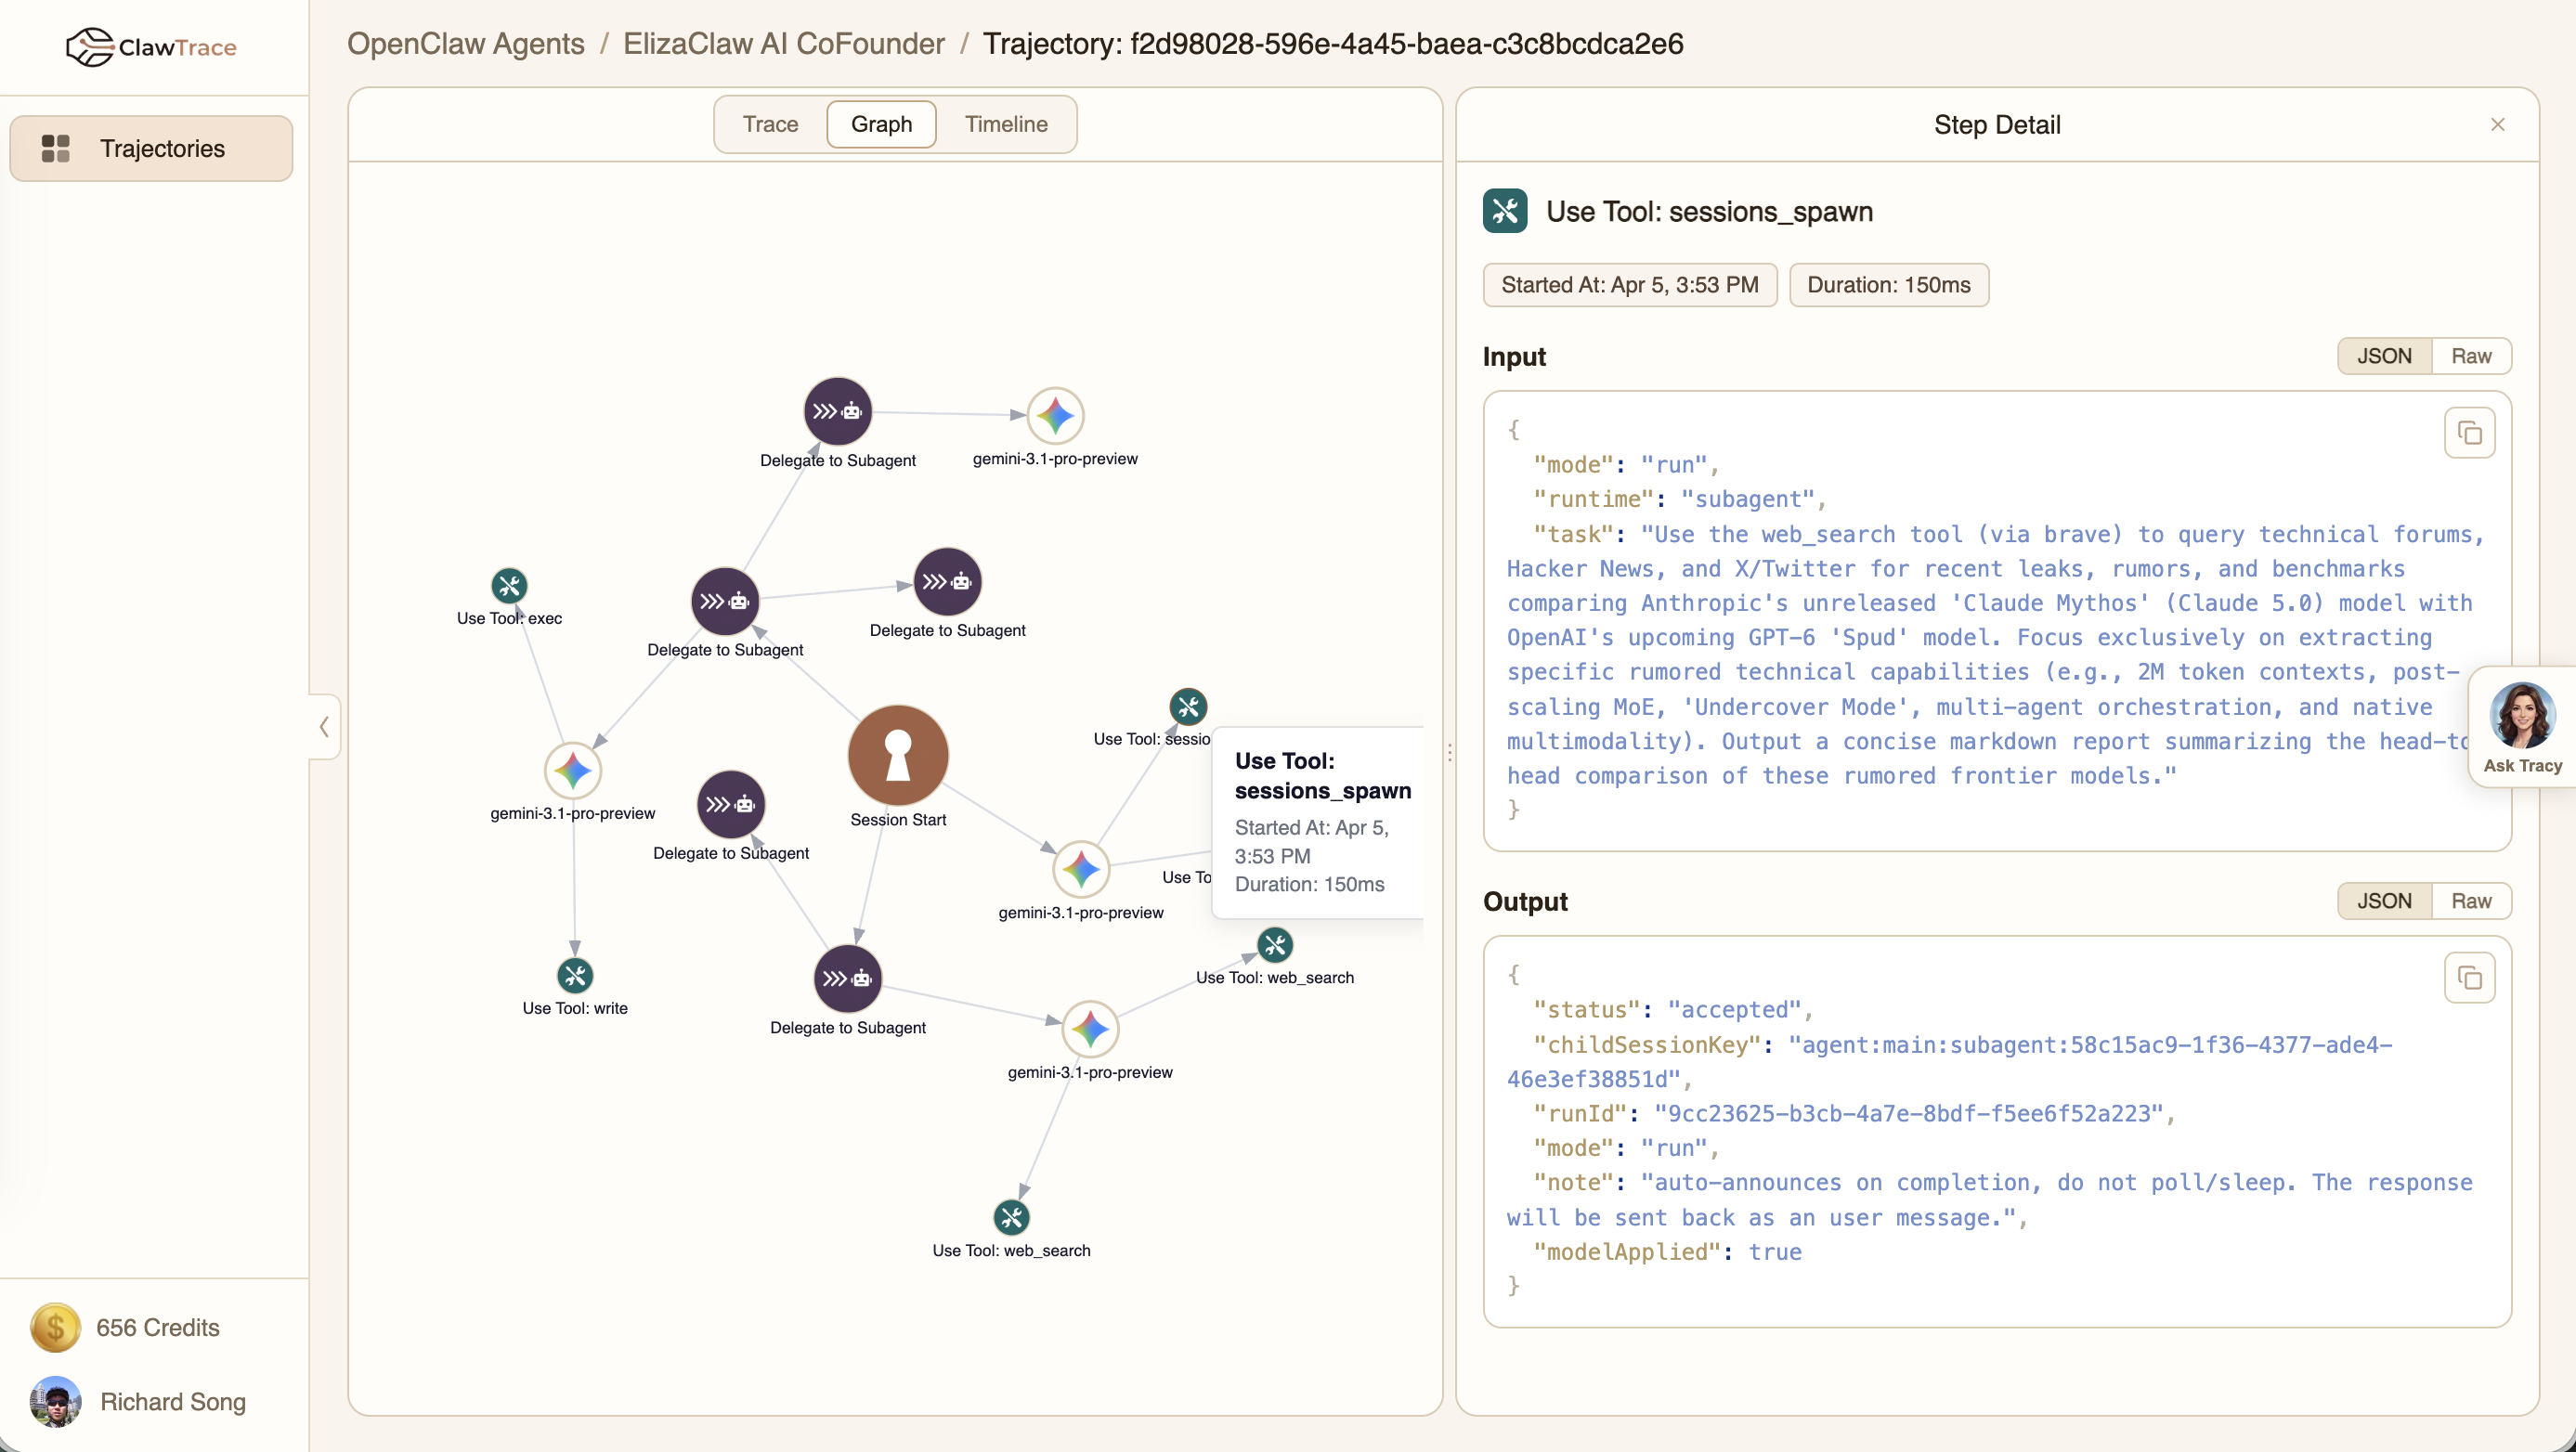
Complex agents are rarely linear. They are graphs. The Call Graph is an interactive, force-directed diagram that visualizes the relationships between every component in your run. You can see at a glance how your primary agent delegates to a specialized sub-agent, which in turn calls three different tools and two different LLM models. It reveals the true architecture of your agent's "thought process," making it immediately obvious how components are interconnected and where dependencies lie. For multi-agent systems, this view is a revelation.
3. The Timeline: The Hunt for Bottlenecks
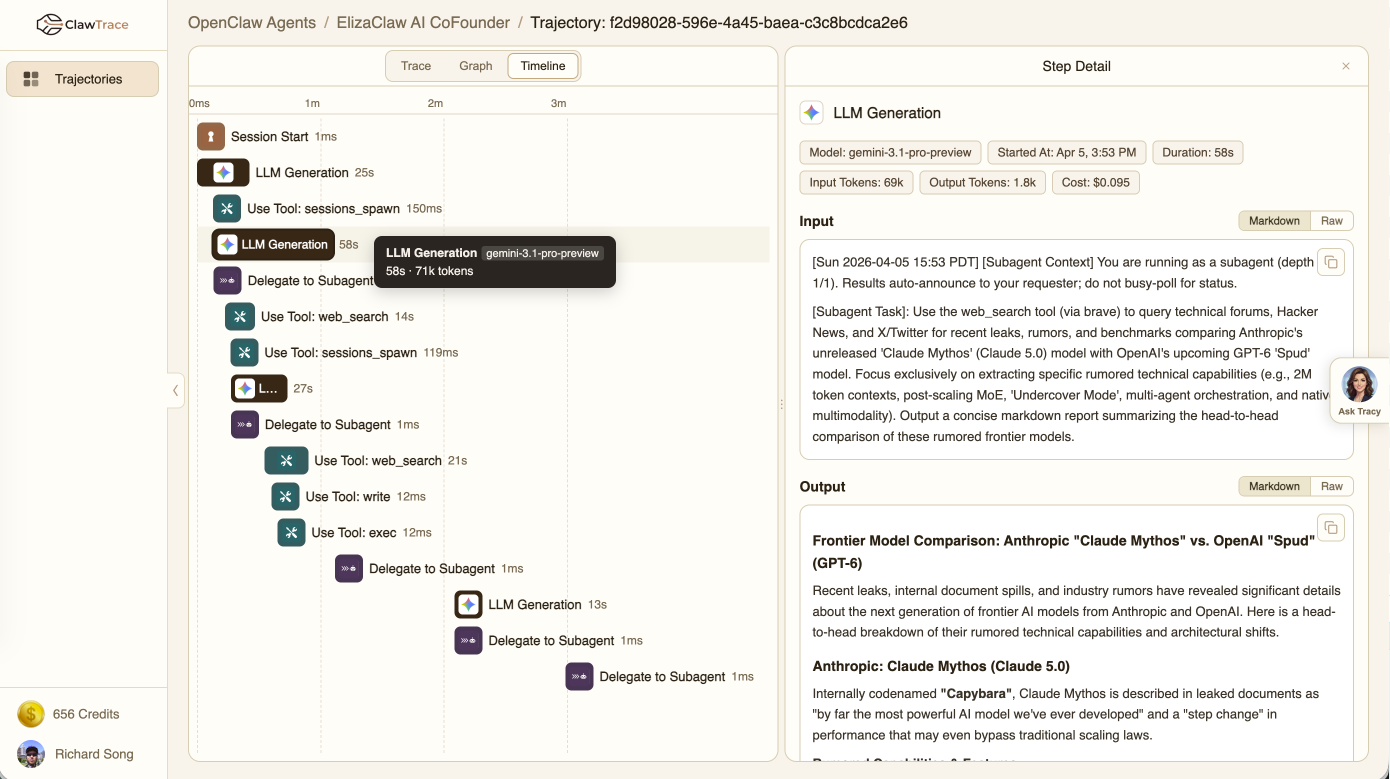
Where did the time go? The Timeline view answers this question definitively. It’s a Gantt chart that visualizes every span in the trajectory, positioned by its start time and sized by its duration. Performance bottlenecks, unnecessary sequential operations that could be parallelized, and long periods of idle time jump off the screen. You can instantly spot that one slow API call in a tool that’s holding up the entire chain or the Llama 4 call that’s taking five times longer than expected.
4. Cache-Aware Cost Estimation: Financial Control
We don't just estimate costs; we obsess over their accuracy. ClawTrace has built-in, continuously updated pricing for over 80 models across every major provider: OpenAI, Anthropic, Google, DeepSeek, Mistral, and more. Crucially, our estimation is cache-aware. It understands the different pricing for fresh input tokens, cached input tokens (via technologies like Model Context Protocol, or MCP), and output tokens. This gives you a far more accurate picture of your true spend, from a single run to your entire project.
Tracy: Your OpenClaw's Doctor
Every other observability tool stops at the dashboard. They give you the data and wish you luck. This is where ClawTrace makes a generational leap.
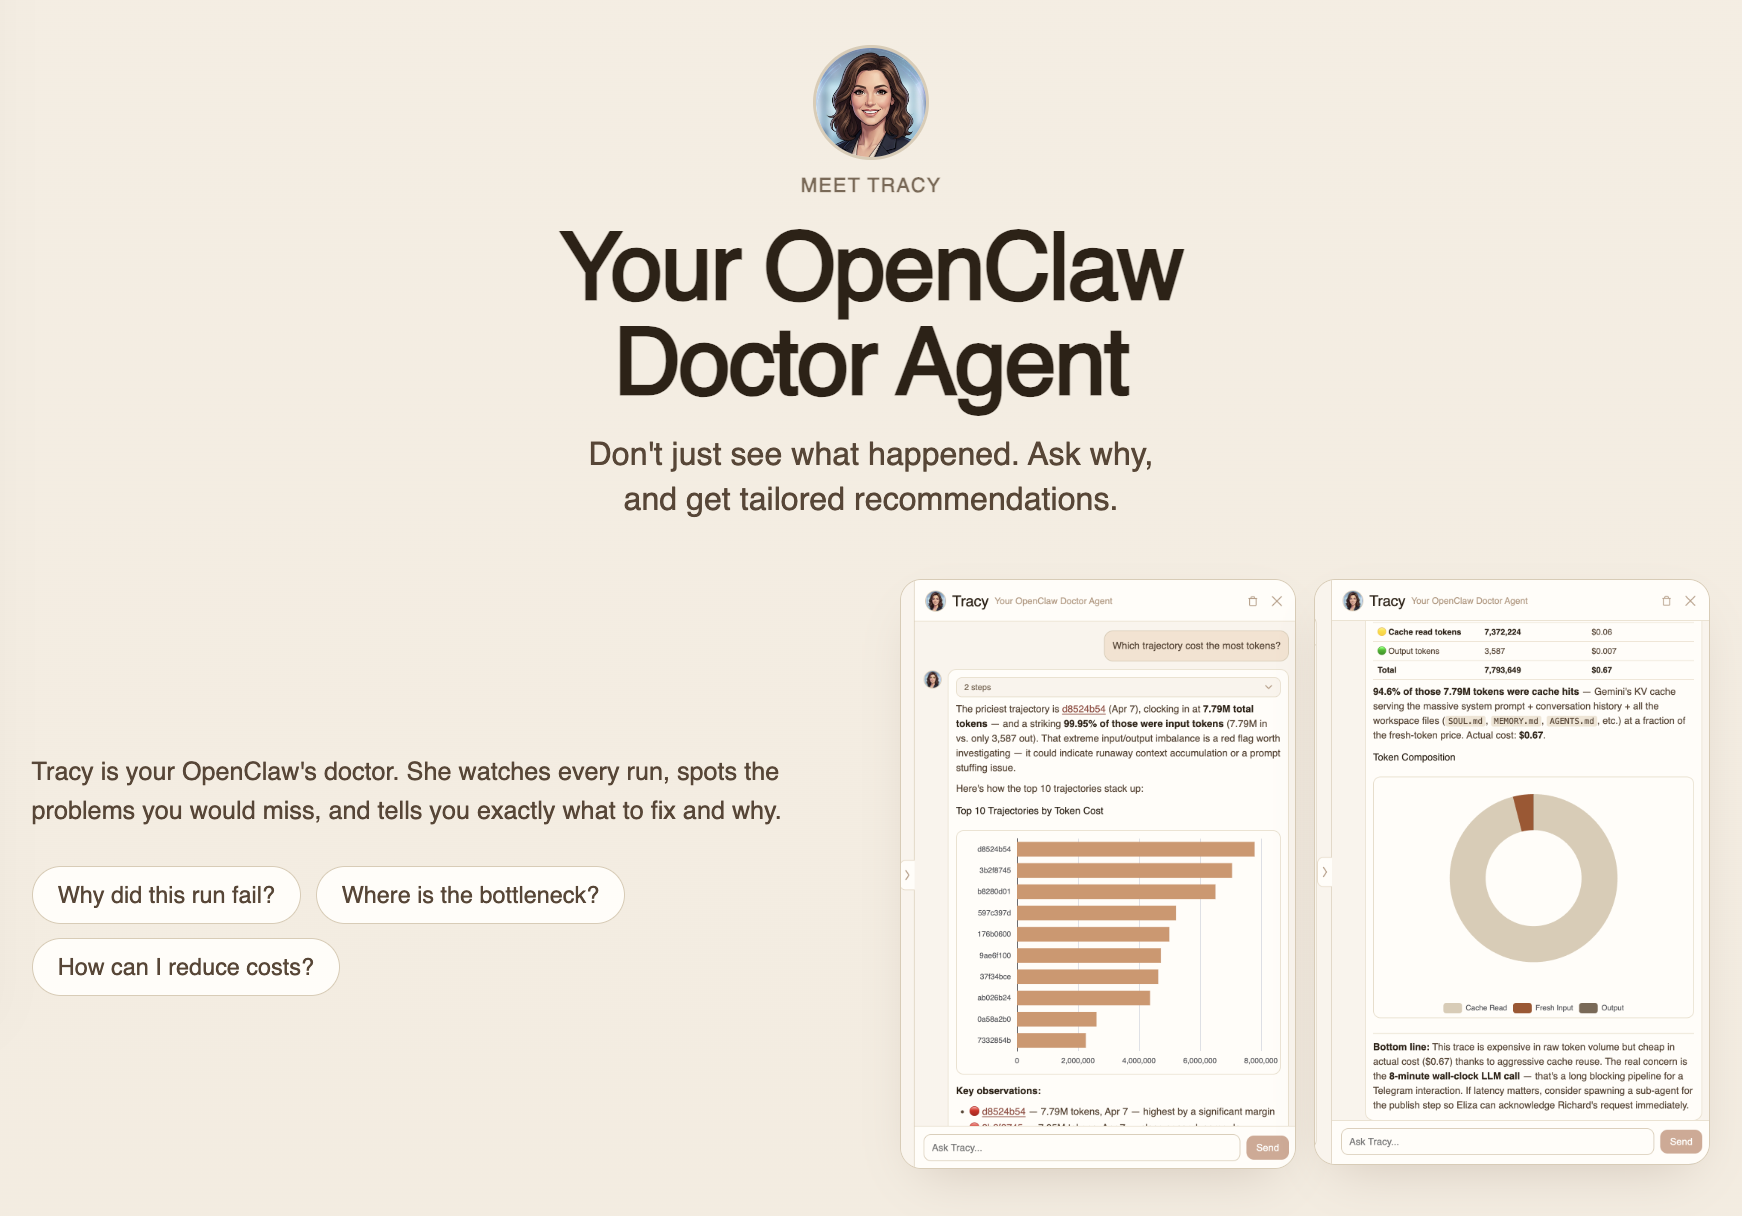
Meet Tracy, your built-in AI analyst.
Tracy is an AI agent dedicated to analyzing your agent’s traces. Instead of you hunting through graphs and timelines, you simply ask Tracy a question in plain English.
- "Where is the bottleneck in this trace?"
- "Why did this run cost 50x more than the average?"
- "What was the root cause of the failure in the final step?"
- "Show me the full prompt and completion for the most expensive LLM call."
This isn't a chatbot. Tracy is a fully integrated diagnostic engine. Powered by a sophisticated Claude Managed Agent, Tracy receives your query, translates it into a series of complex Cypher queries, and executes them against the full semantic graph of your trajectory data. This entire backend runs on PuppyGraph, our serverless graph lake-house architecture, allowing for real-time, complex graph traversal over massive datasets.
Tracy doesn’t just give you data; she gives you a diagnosis. She’ll generate a custom visualization to illustrate her point and provide specific, actionable recommendations: "The primary bottleneck is the process_document tool, which took 18.7 seconds. This is because it's making a sequential API call for each page. Consider parallelizing these calls to reduce latency."
This is the future of observability: moving from data interpretation to automated analysis.
The Ask
AI agents are leaving the lab and entering the real world. The transition from a cool demo to a reliable, production-grade service requires a new class of tooling. ClawTrace is that tooling. It is the essential control plane for making the promise of OpenClaw a production reality.
We built the tool we desperately wished we had. Now, we want you to have it.
- 🚀 Sign up for free at clawtrace.ai. You get 100 free credits to start, and your first trajectory will appear in minutes. See for yourself.
- ⭐ Star us on GitHub. ClawTrace is fully open source under Apache 2.0. We believe foundational infrastructure should be open.
- 💬 Tell us what you're building. Schedule a call with me. I want to hear about your OpenClaw setup, the problems you're facing, and how we can build the future of agentic infrastructure together.
The era of flying blind is over. It’s time to build.
FAQ: ClawTrace and Agent Observability
How does ClawTrace handle data privacy and security?
Your data security is paramount. The ClawTrace plugin communicates with our backend via TLS-encrypted gRPC. We are SOC 2 Type II compliant and offer options for on-premise deployment or deployment within your own VPC for enterprise customers, ensuring your sensitive prompt and completion data never leaves your control.
What is the performance overhead of the ClawTrace plugin?
Negligible. The plugin is designed for high-performance, asynchronous data streaming. It operates out-of-band from your agent's critical execution path, batching and sending trace data in the background. We’ve benchmarked the typical end-to-end latency overhead at less than 5ms per trace, making it safe for production workloads.
Does ClawTrace work with custom tools or models in my OpenClaw agent?
Yes, absolutely. ClawTrace automatically captures any function or class decorated as an OpenClaw Tool. For custom or fine-tuned models not in our database of 80+, you can easily add custom pricing rules in your project settings to ensure accurate cost tracking and analysis across your entire, unique stack.